Home / What do Americans think is the biggest threat from global warming?
Americans have become more worried about and interested in global warming and started to perceive it as a greater risk in recent years, but less is known about which specific threats they find most concerning. We asked Americans to tell us – in their own words – what they think is the greatest threat global warming poses to the United States. We then categorized their answers to identify common themes.
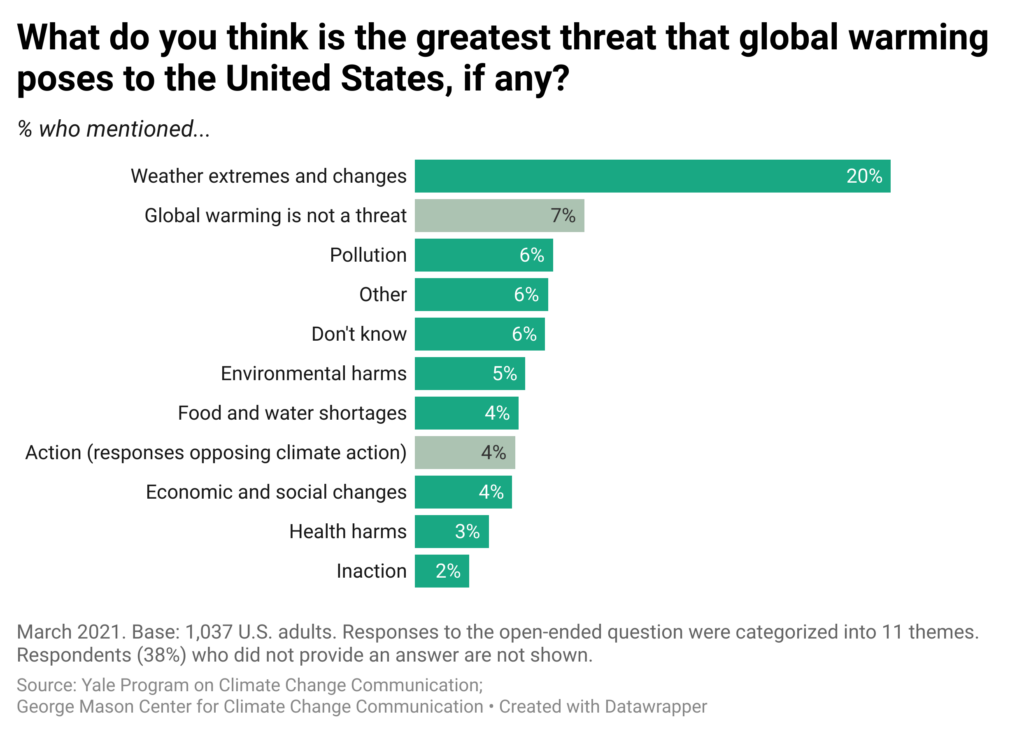
In our March 2021 Climate Change in the American Mind survey, respondents ( n = 1,037) were asked an open-ended question: “What do you think is the greatest threat that global warming poses to the United States, if any?” While 38% of Americans did not respond to the question, 62% provided responses that were then categorized into 11 themes by a team of researchers (see the Methods section for more details).
The most common theme was Weather extremes and changes (20% of Americans), which included different types of extreme weather (e.g., floods, wildfires, droughts, hurricanes, extreme temperatures), changing weather patterns, and seasonal shifts. Many respondents in this category listed multiple extreme events, such as wildfires and droughts, or heat waves and flooding.

The second most common theme was Global warming is not a threat (7%), which included statements about not being worried about climate change or expressing positions that raise doubts about climate science and scientists. For example, one response in this category was “none. Global warming is something that happens, regardless of whatever they say,” while another was “it’s not real.”
The third most common themes were Pollution (6%), Other (6%), and Don’t know (6%). Respondents in the Pollution category mentioned specific pollution sources, such as “carbon dioxide,” “vehicle emissions,” or “waste disposal.” The Other category included general responses that did not fit other categories (e.g., “humans” or “the government”). Finally, some respondents simply indicated they did not know or had no response to the question.
Some respondents mentioned Environmental harms (5%) (e.g., “what we are doing to our oceans” and “loss of animal species, destruction of coastline and aquatic species”).
Other categories included Food and water shortages (4%), Action (responses opposing climate action, 4%), and Economic and social changes (4%). Responses about food and water shortages included “wide scale famine” and “hotter and dryer temperatures ruining agriculture.” The Action category included responses from people who said the biggest threat posed by global warming comes from efforts to address it (e.g., “making changes that will actually do more harm” and “artificially scaring people by exaggerating the effects of climate change”). Responses about Economic and social changes included “displacement of large portions of the population,” “property damage and destruction,” and “social unrest and upheaval.”
Relatively few respondents mentioned Health harms (3%) such as “death from extreme conditions” or “the well being of the people.” Finally, some respondents thought that the biggest threat is Inaction (2%) or not doing enough to address global warming (e.g., “ignoring it that it is happening and political agendas that promote fossil fuels” and “people who don’t believe it is happening”).
Effects of Political Party Identification on Perceptions of Global Warming Threats
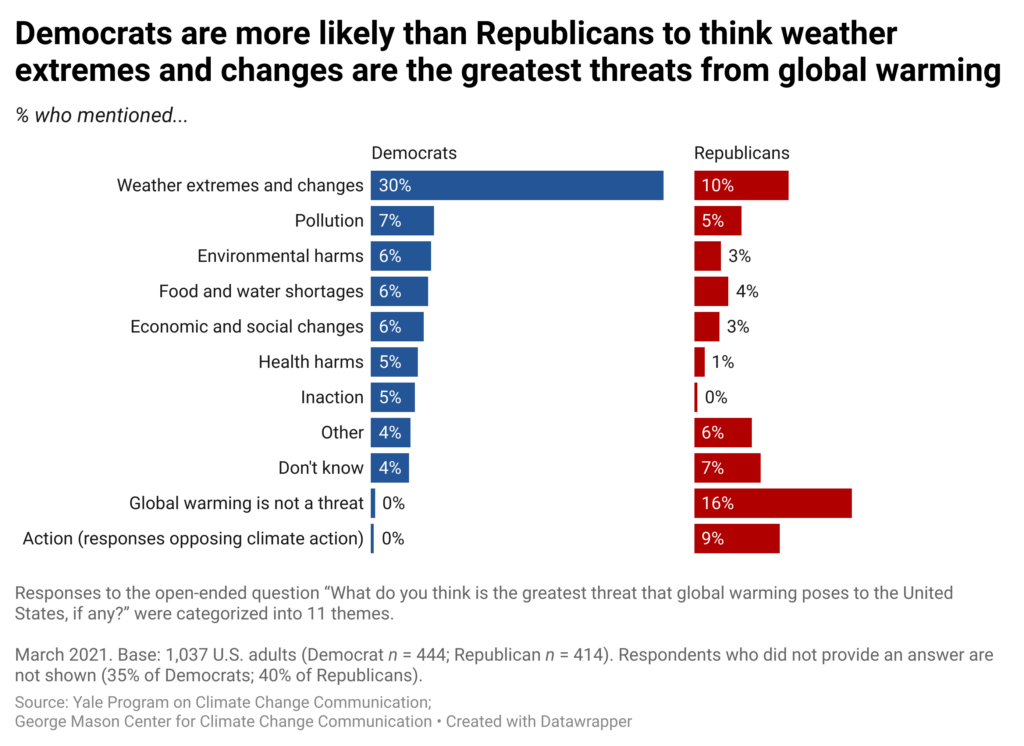
Democrats (30%) were more likely than Republicans (10%) to mention Weather extremes and changes as the greatest threats posed by global warming. Additionally, Democrats (5%) were more likely than Republicans (0%) to say Inaction on global warming is the greatest threat. By contrast, Republicans (9%) were more likely than Democrats (0%) to say Action to address global warming is the greatest threat and were also more likely to say Global warming is not a threat (16% vs. 0% of Democrats).

Similar patterns emerged when investigating responses across Global Warming’s Six Americas – a spectrum of six groups within the American public ranging from those who are most worried about global warming (the Alarmed and Concerned) to those who are least worried (the Doubtful and Dismissive). The Alarmed and Concerned were the most likely to mention Weather extremes and changes as the greatest threats, while the Doubtful and Dismissive were the most likely to say Global warming is not a threat (refer to the data tables for all categories across the Six Americas). Additionally, these four segments were the most likely to respond to the open-ended question, while the Cautious and Disengaged (who are generally less engaged with global warming) were the least likely to respond.
These results are consistent with our recent Climate Change in the American Mind survey showing that most Americans (65%) think global warming is affecting the weather in the U.S., and a majority (56%) think extreme weather poses a risk to their community. Additionally, most Americans think global warming is affecting many weather-related problems (especially extreme heat, wildfires, and droughts) and many are worried about the harms from these problems in their local area. Americans care about these climate events—a recent analysis of summer 2023 news stories found that Americans knew and cared the most about stories on extreme weather (e.g., the Maui wildfires).
Extreme weather-related events demonstrate the dangerous consequences of climate change, right here, right now. Continuing to inform the public about these risks is vital, as is helping people understand that the impacts don’t stop once an extreme weather event is over. The cascading effects of climate change are profound: extreme heat leads to droughts, affecting agriculture and food prices; more frequent and severe storms are already disrupting power grids and transportation systems; and rising sea levels destroy homes and displace communities, which in turn puts pressure on inland areas. All of these impacts have multiplier effects that spread through society, affecting healthcare, jobs and financial markets, and national security. Moreover, these negative impacts will continue to intensify as long as we continue to emit carbon pollution.
The results of this report are based on data from the March 2021 wave ( n = 1,037) of the biannual Climate Change in the American Mind survey – a nationally representative survey of U.S. public opinion on climate change conducted by the Yale Program on Climate Change Communication and the George Mason University Center for Climate Change Communication . Data were collected from March 18 – 29, 2021 using the Ipsos KnowledgePanel®, a representative online panel of U.S. adults ages 18 and older. Questionnaires were self-administered online in a web-based environment.
Respondents were asked “What do you think is the greatest threat that global warming poses to the United States, if any?” and were provided a text-box to type in their answer. These responses were coded into categories by a team of three researchers. First, the lead author/primary investigator explored themes, developed a list of categories that emerged from the data, and completed the first round of exploratory coding independently. If a category included less than 5% of respondents, the research team considered if it should be combined with other categories (e.g., extreme weather and weather changes + specific natural disasters). This list went through an iterative process of being refined by the research team until a final list of 11 themes/categories were selected. Coding definitions were developed by the team of researchers. The lead author/primary investigator coded all 672 open-ended responses following these definitions and selected up two categories per response. Some respondents did not provide a codable response (e.g., “N/A” or a blank response) leaving a total of 664 respondents with codes. To assess reliability, two other researchers selected a random sample of at least 10% of responses and independently coded the data (agreement ranged from 89% to 94%). In the case of coding disagreements across researchers, the research team discussed the coding until there was consensus on what the final code(s) should be. The results presented here represent the final categories all three researchers agreed with.
References to Republicans and Democrats include respondents who initially identify as either a Republican or Democrat, as well as those who do not initially identify as a Republican or Democrat but who say they “are closer to” one of those parties (i.e., “leaners”) in a follow-up question. The category “Independents” does not include any of these “leaners.” The Global Warming’s Six Americas analysis used the Six Americas Super Short Survey (SASSY) tool .
Data were weighted to align with demographic parameters in the United States. In figures/data tables, bases specified are unweighted, while percentages are weighted to match national population parameters. For tabulation purposes, percentage points are rounded to the nearest whole number. Example quotes for the coded categories and the data tables used to develop the charts/figures can be found here. The average margin of error is +/- 3 percentage points at the 95% confidence interval for the full sample of U.S. adults ( n = 1,037). Average margins of error for subgroups are as follows: +/- 4.7 percentage points for Democrats ( n = 444), +/- 4.8 percentage points for Republicans ( n = 414), +/- 6.2 percentage points for the Alarmed ( n = 247), +/- 5.5 percentage points for the Concerned ( n = 315), +/- 7.4 percentage points for the Cautious ( n = 176), +/- 14.8 percentage points for the Disengaged ( n = 44), +/- 8.7 percentage points for the Doubtful ( n = 126), and +/- 8.7 percentage points for the Dismissive ( n = 126).
Marlon, J., Ballew, M., Verner, M., Carman, J., Rosenthal, S., Kotcher, J., Maibach, E., & Leiserowitz, A. (2023). What do Americans think is the biggest threat from global warming? Yale University and George Mason University. New Haven, CT: Yale Program on Climate Change Communication.
The research was funded by the Schmidt Family Foundation, the U.S. Energy Foundation, the MacArthur Foundation, the Heising-Simons Foundation, and the Grantham Foundation.